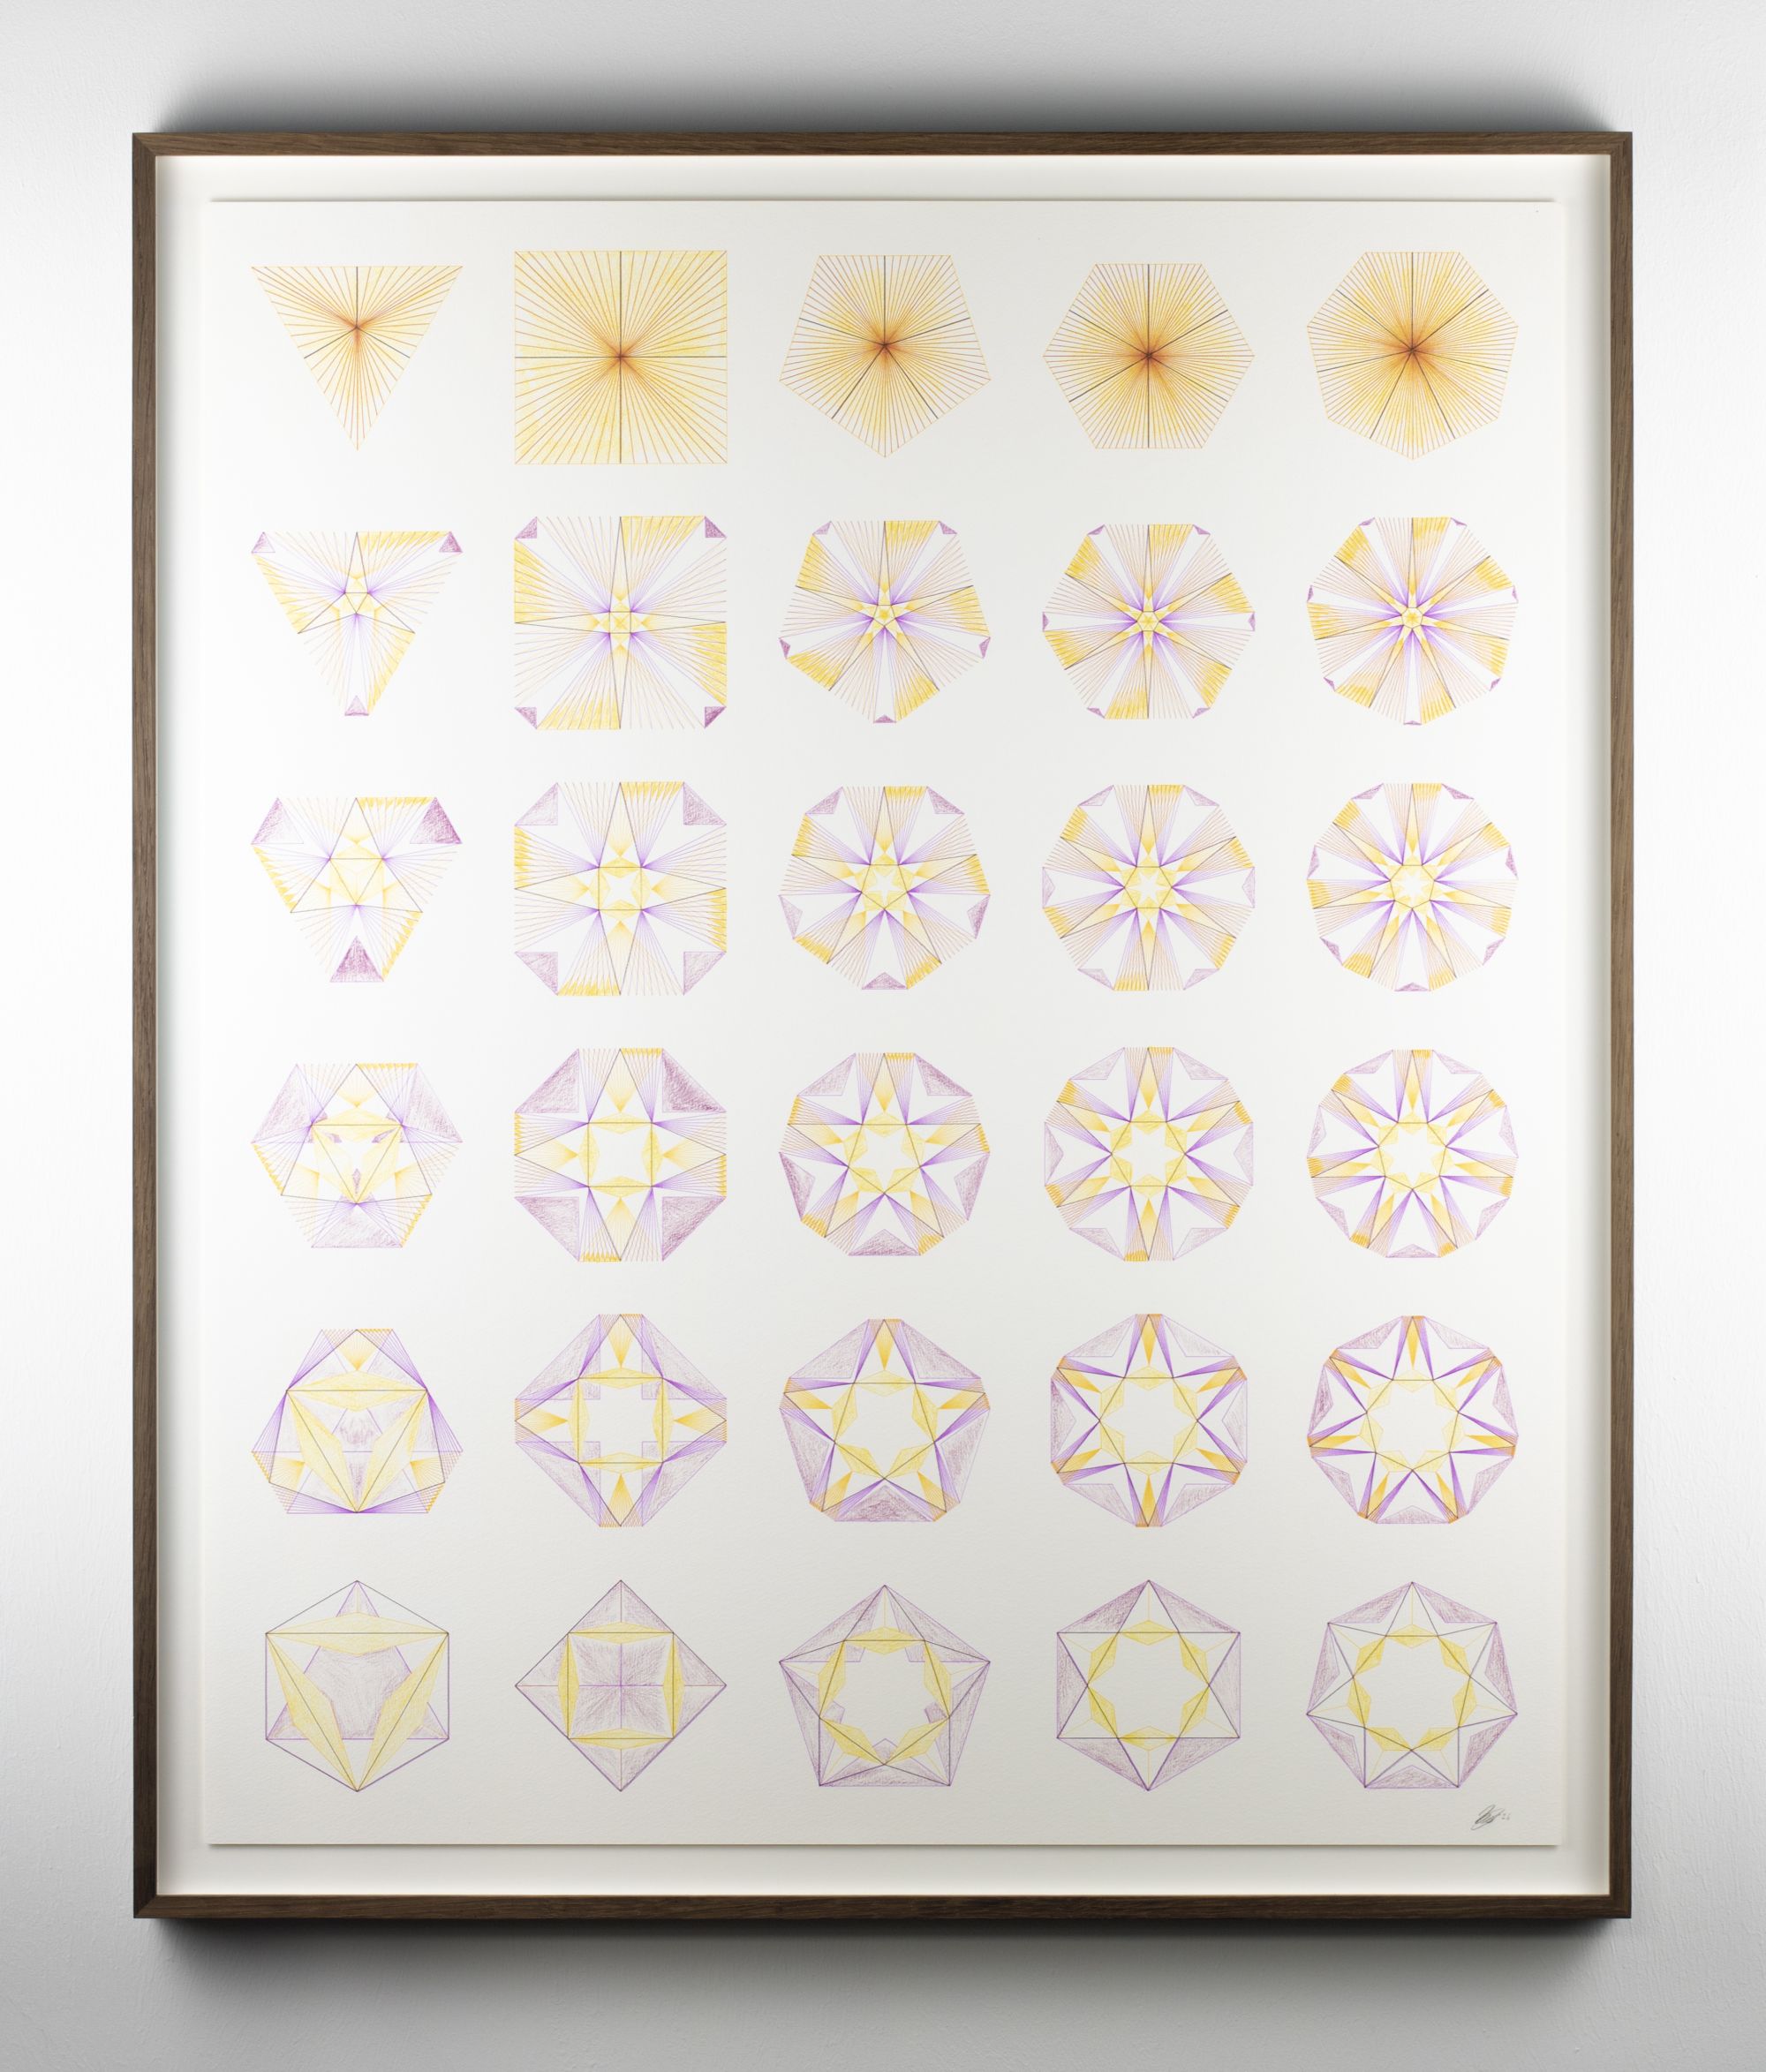
Entfaltung (Tabula I)
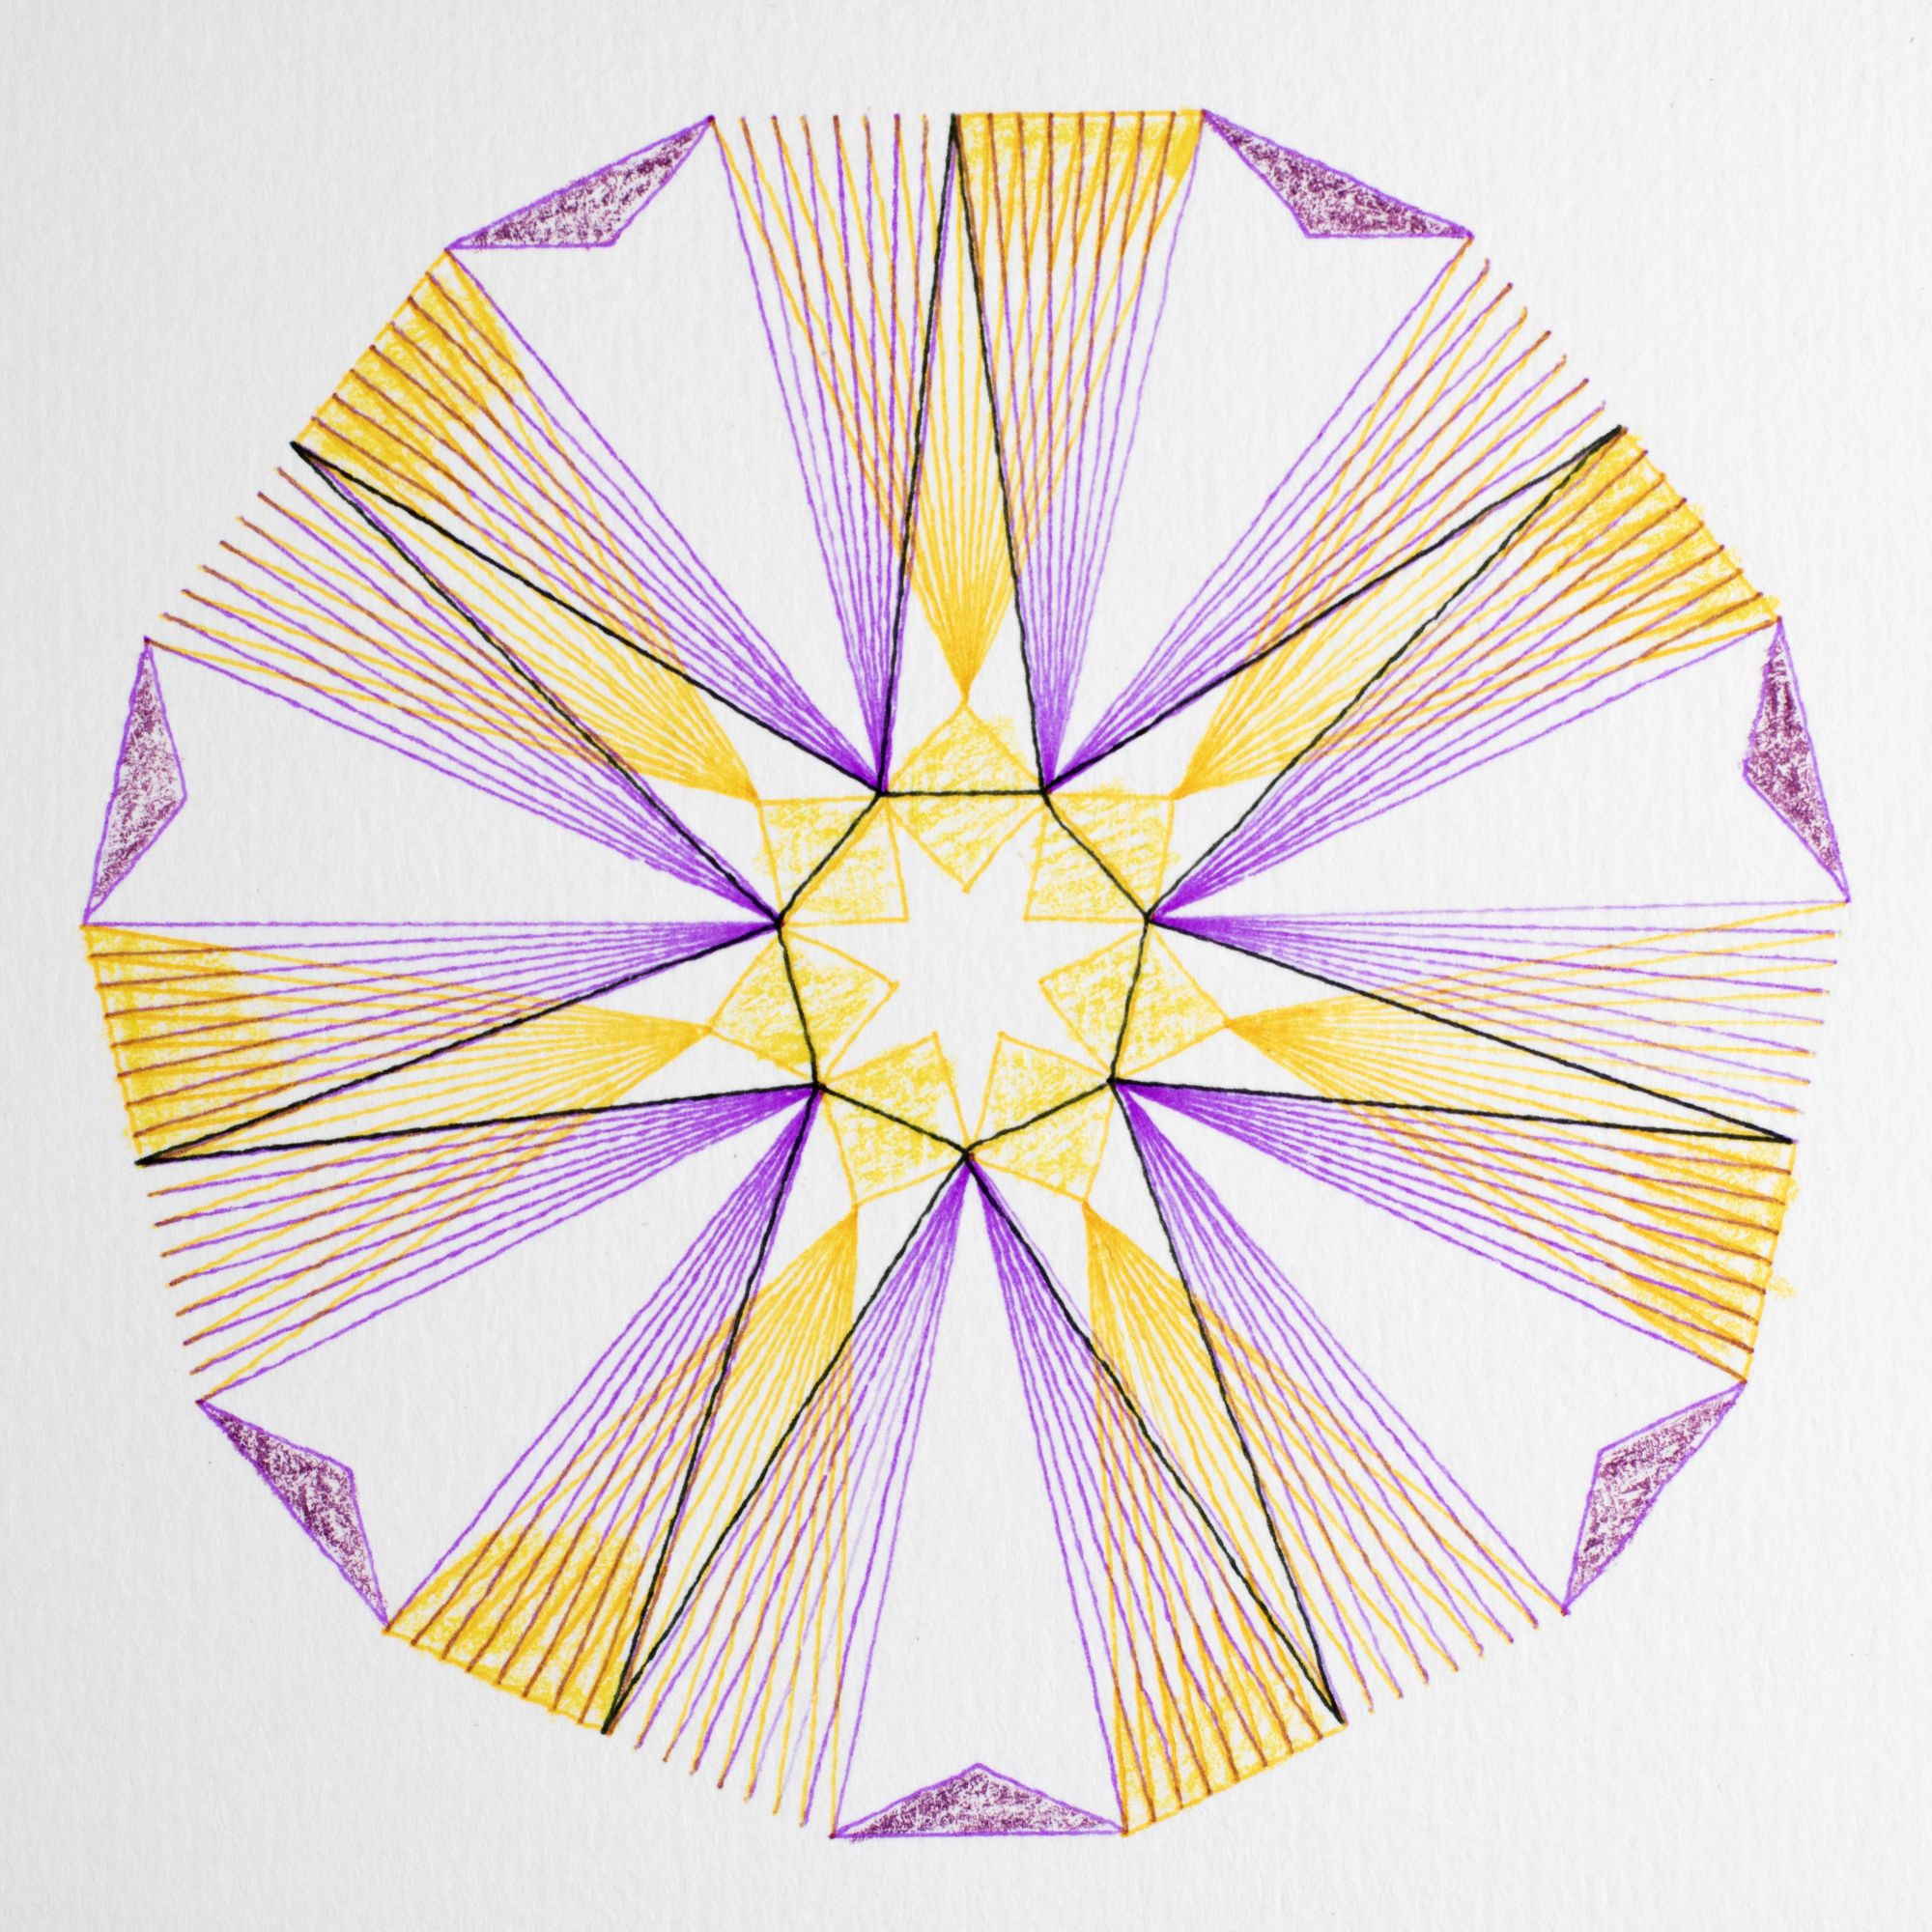
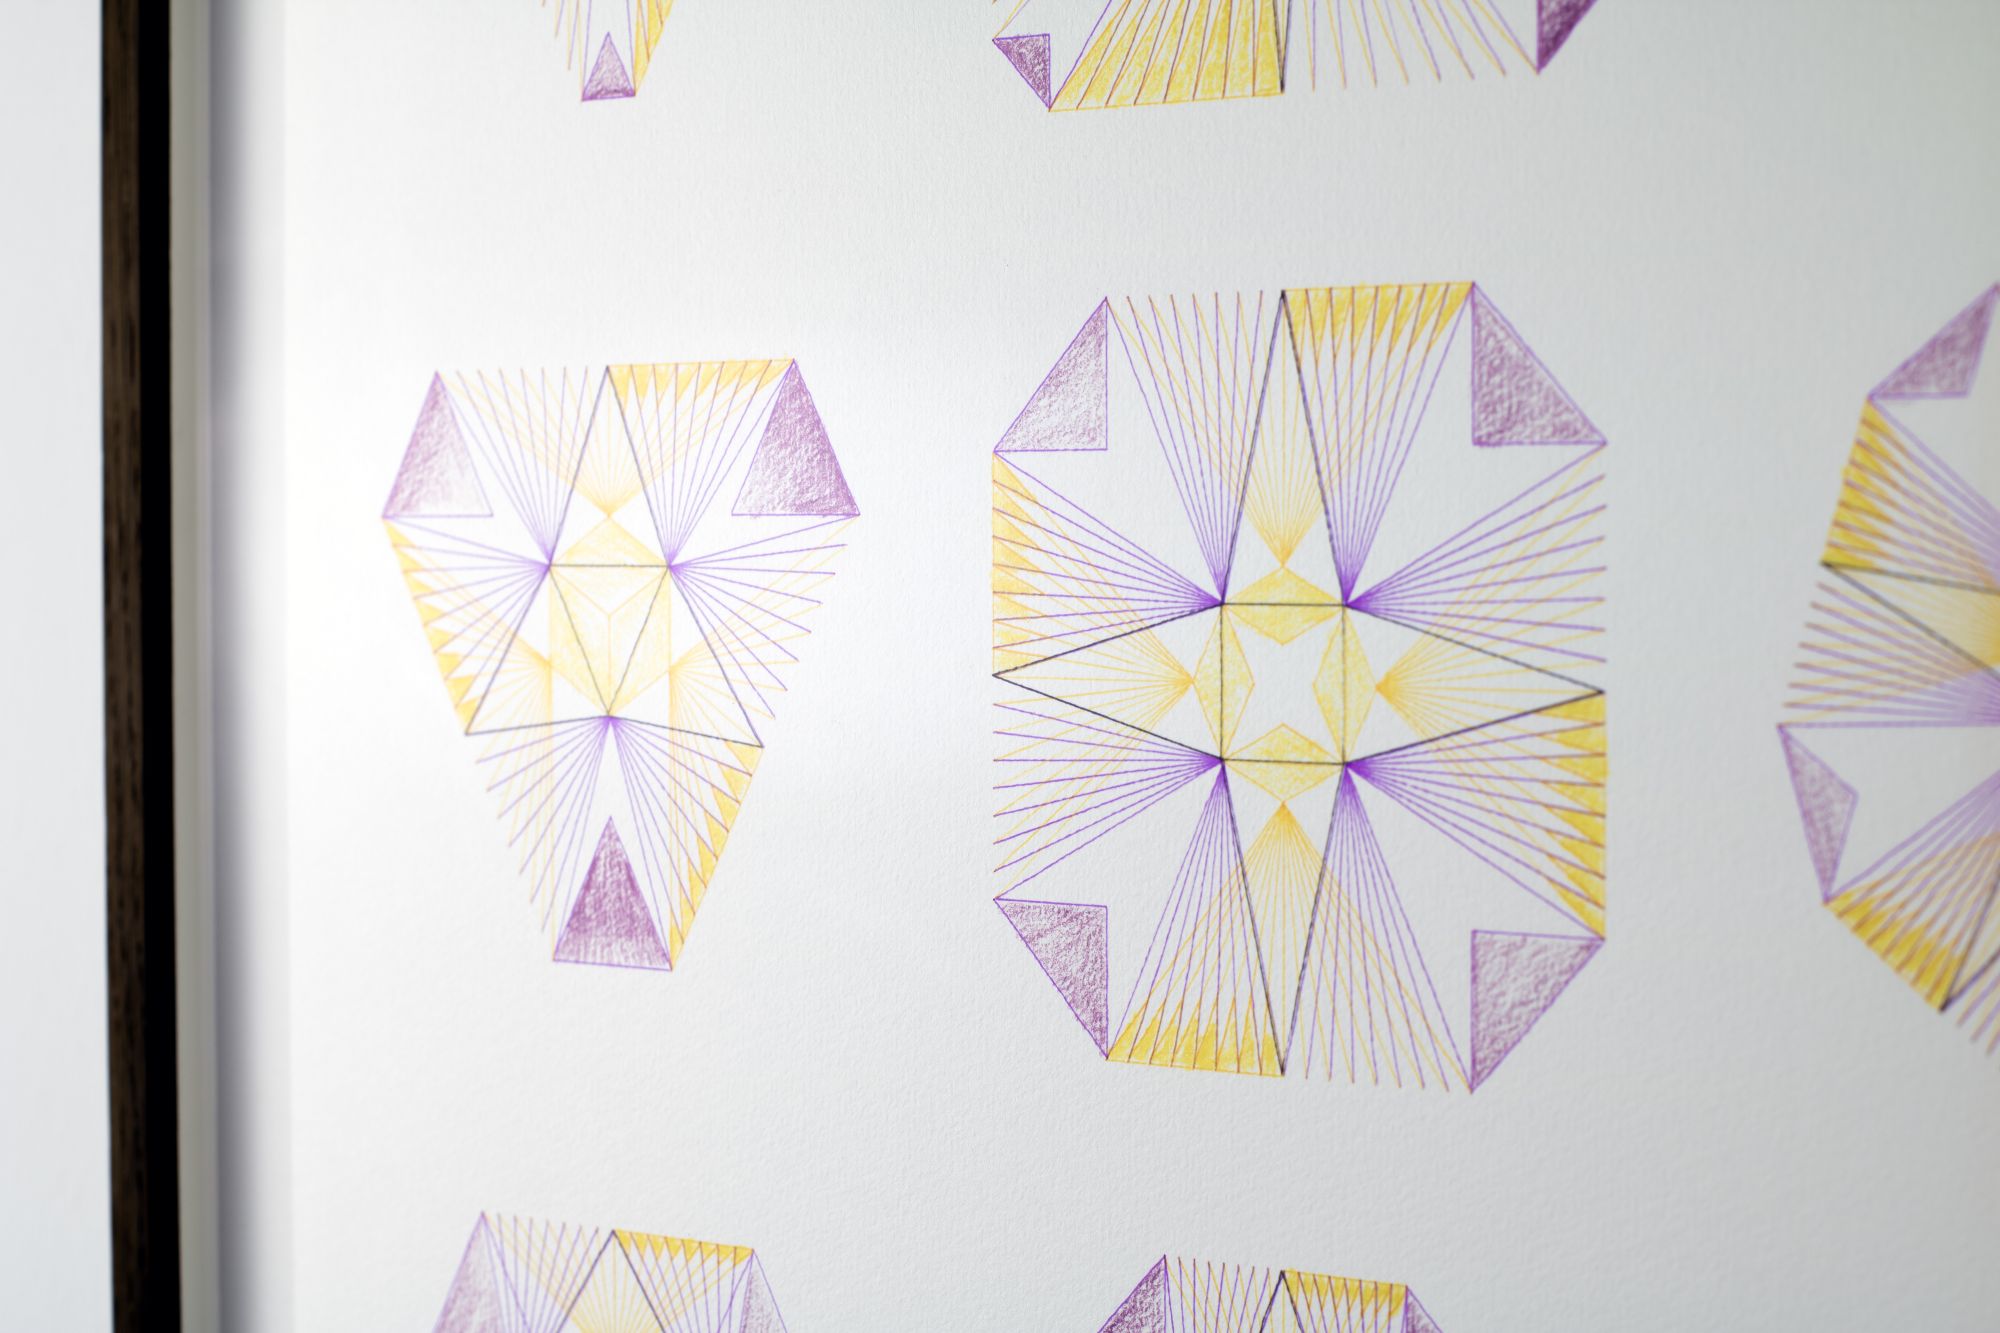
An index of my drawing program: thirty figures in five columns and six rows, each axis varying one parameter. From left to right the number of legs, the outer points of the figure, rises from three to seven, so the outline runs from triangle to heptagon. From top to bottom the inner offset changes: in the top row each figure is a solid fan of lines from its centre, and row by row the inner points move off the centre until the fan has split into a ring of kites around an open middle. The plotter drew the figures in pen, and I coloured them by hand in pencil.
One of two Tabula drawings. To me they recall the wall charts once used in school biology and chemistry lessons, which showed species of animals or electron orbitals side by side, a little like the drawings of Ernst Haeckel.