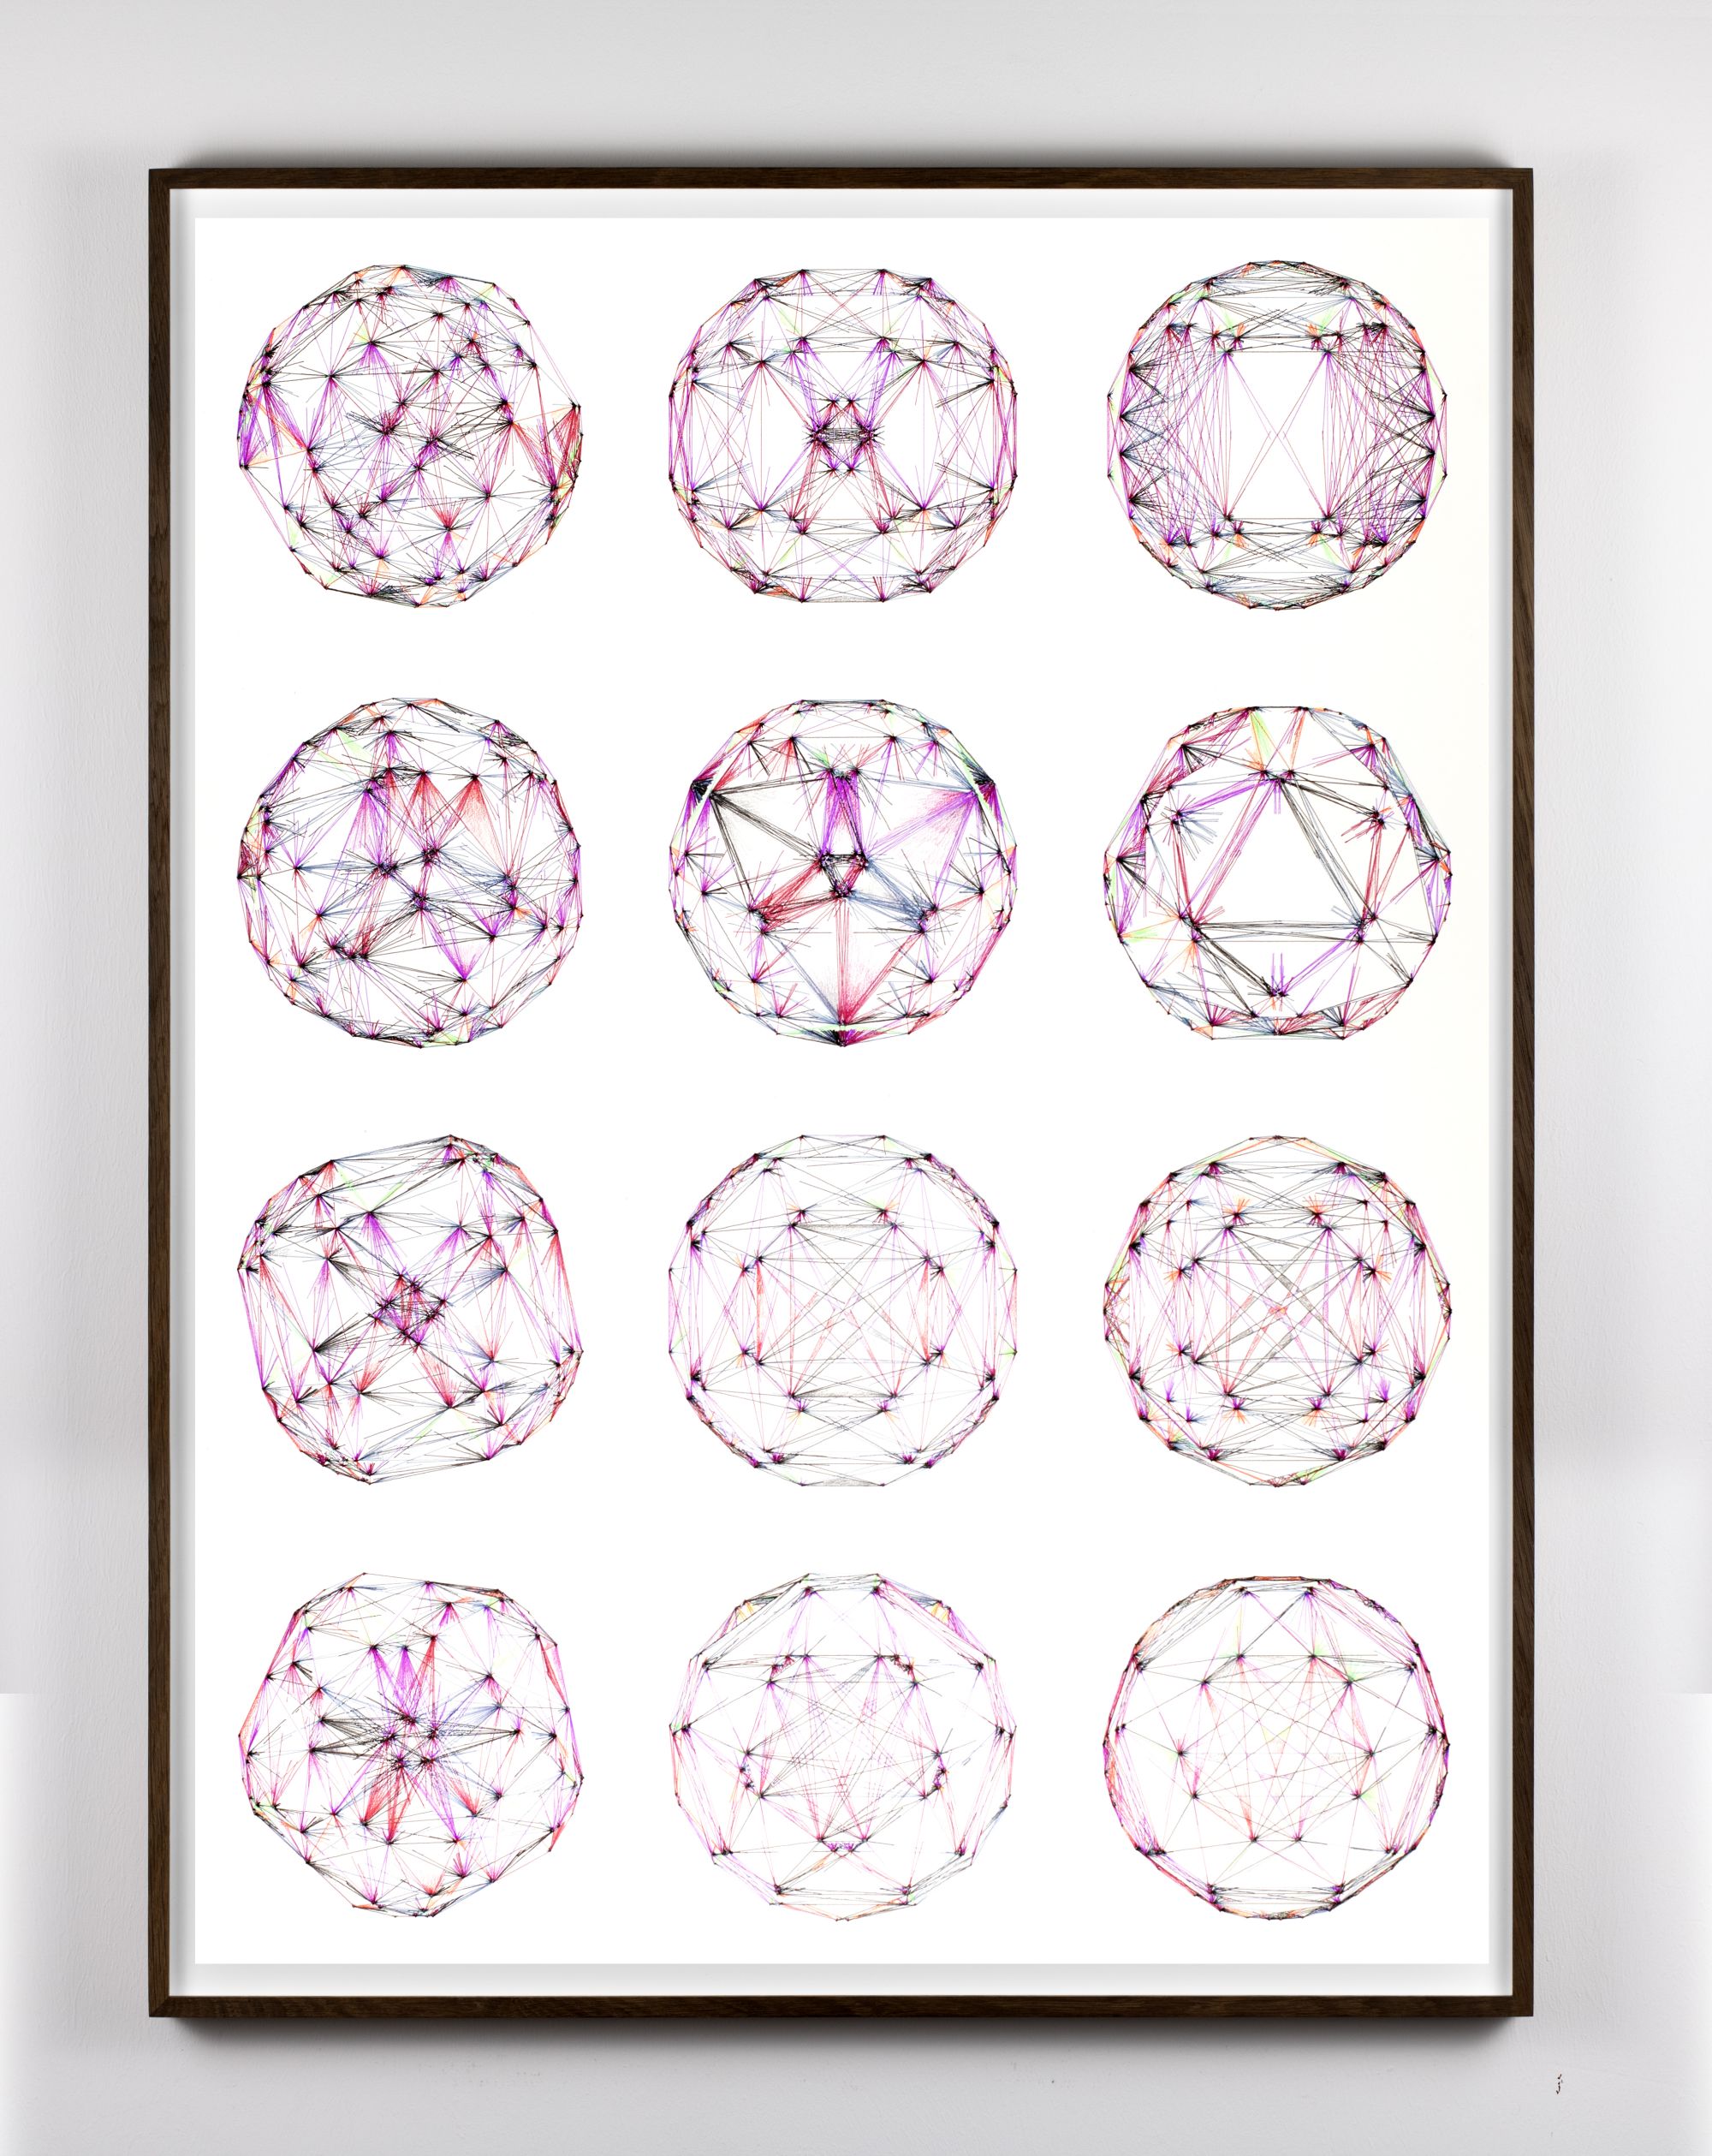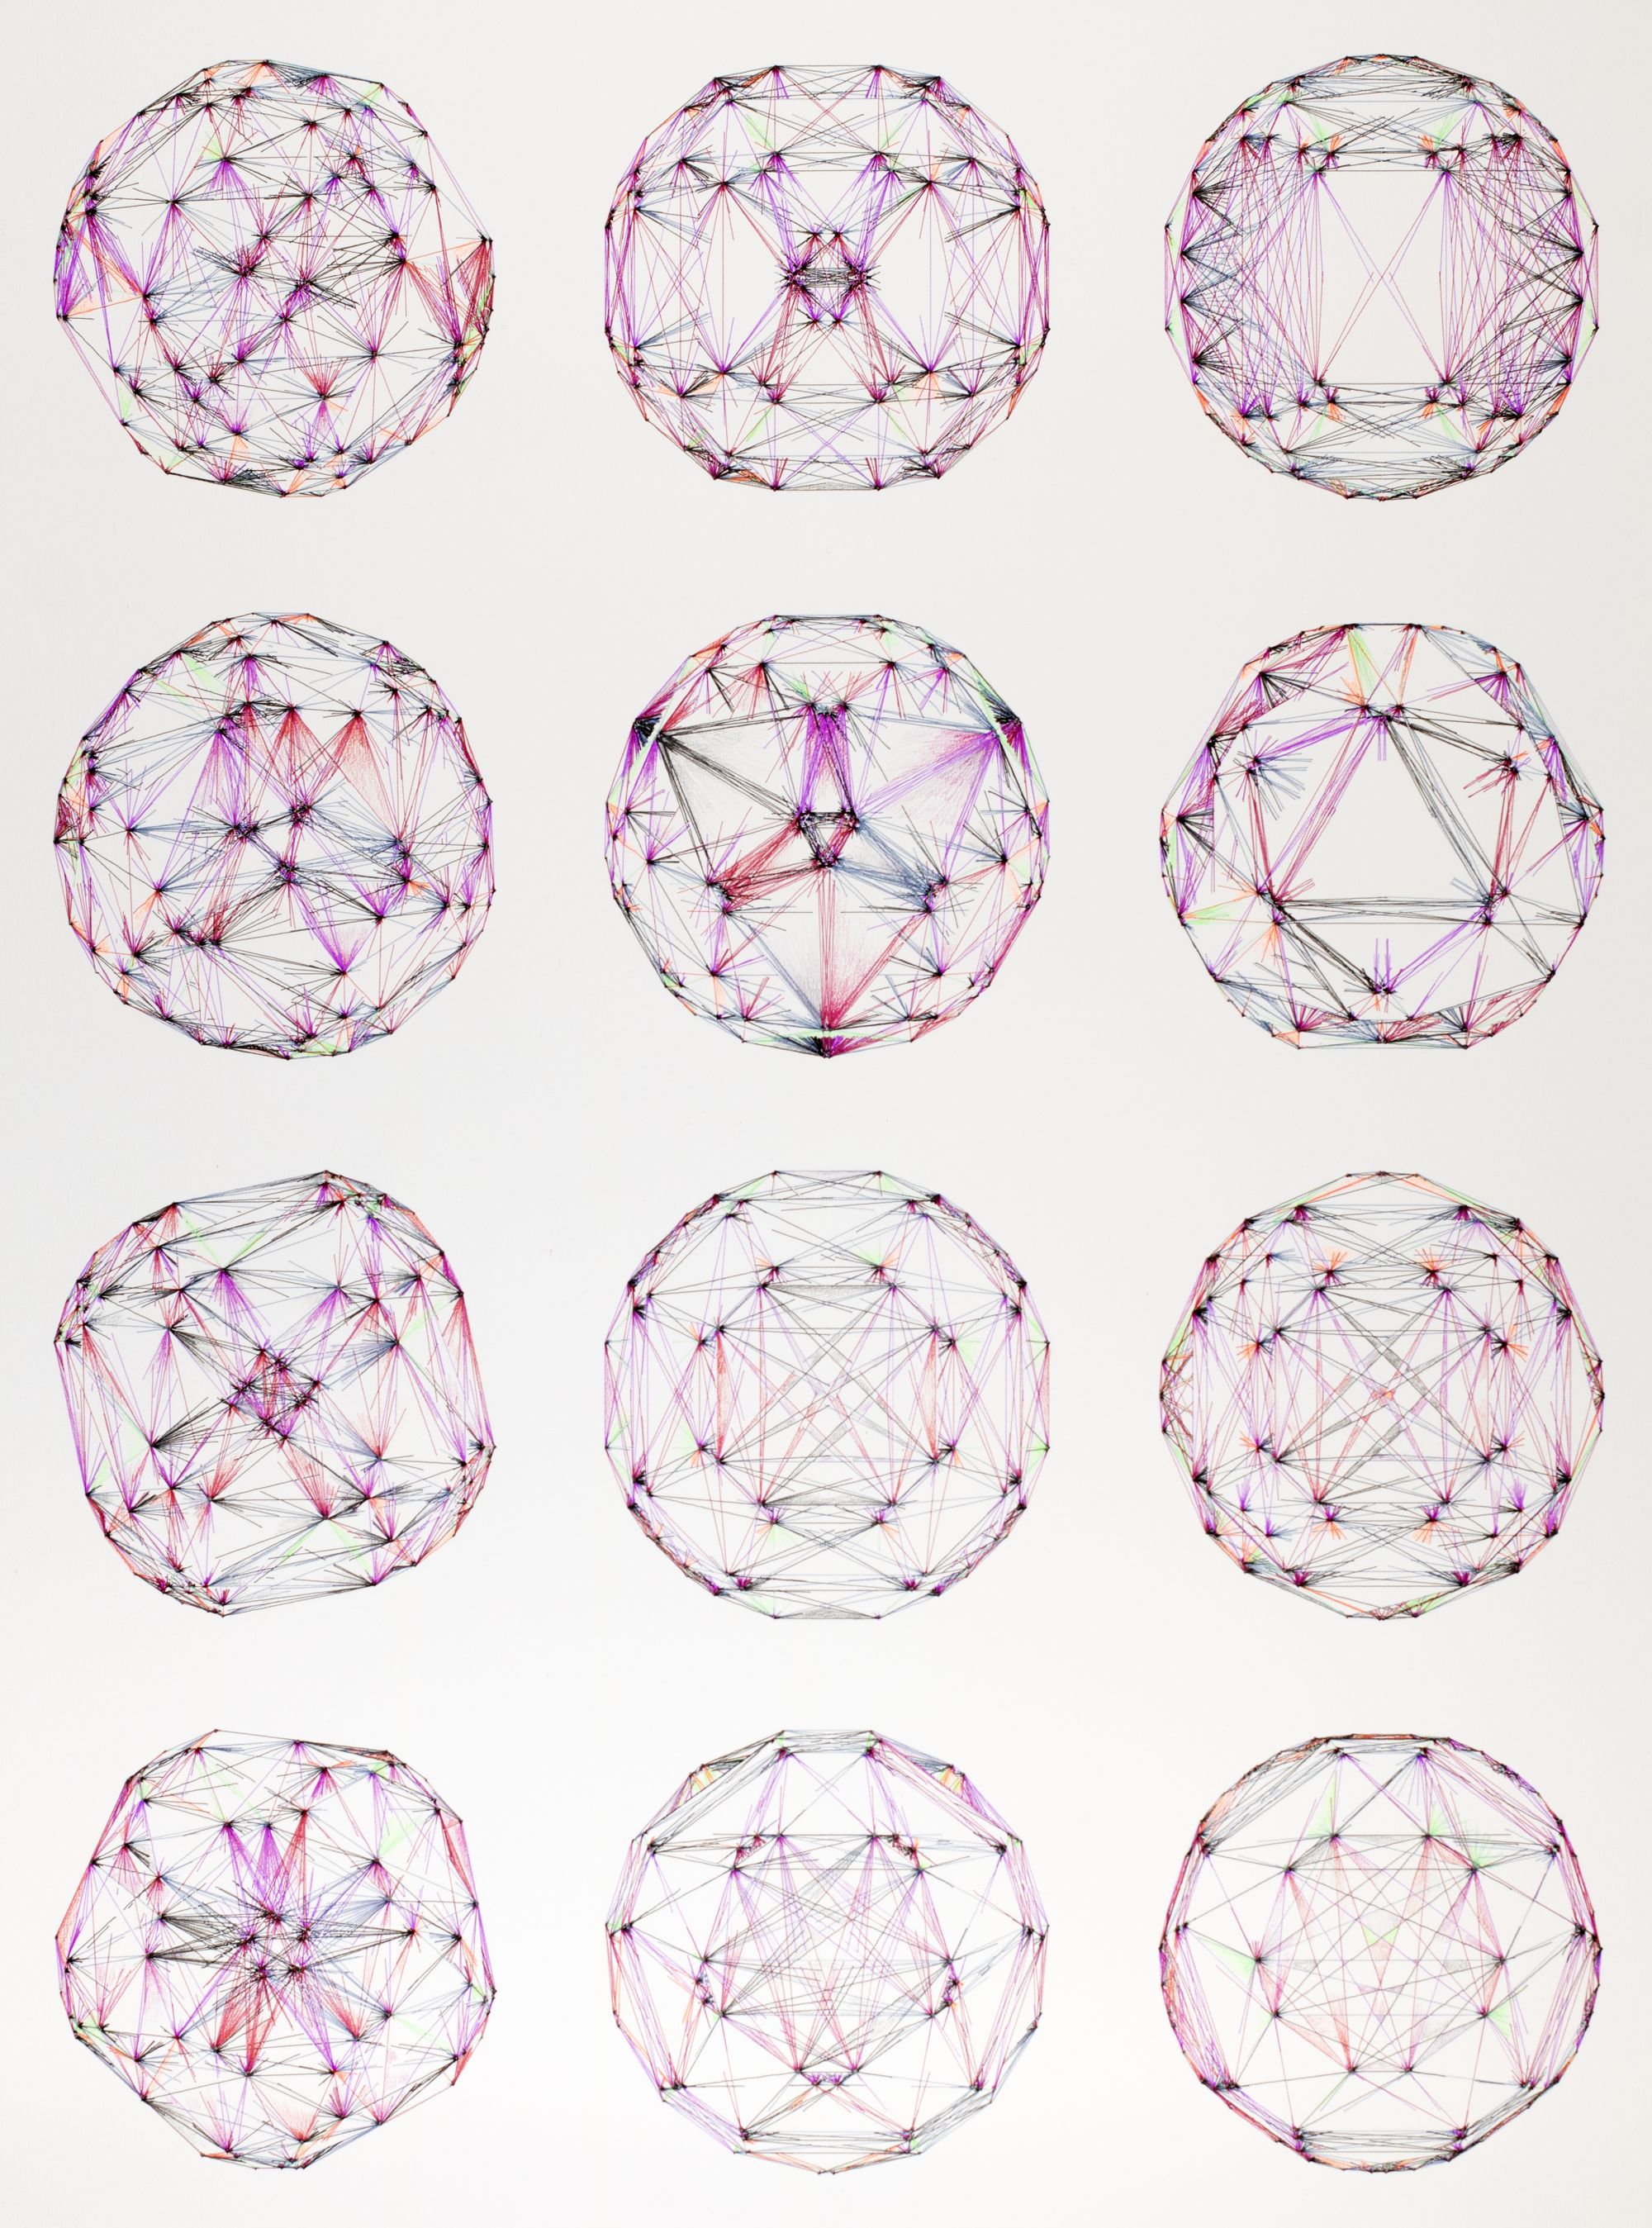
Entfaltung (Tabula II)
Entfaltung Drawing from 2026
An index of my rendering algorithm, showing how it decides what is visible: twelve figures in three columns and four rows. From left to right the sheet steps through three rules for which crossing lines close into a face, and a closed face hides the lines behind it. From top to bottom the main structure grows from two legs to five. The plotter drew the figures in pen, and I coloured them by hand in pencil, partly in neon pencil.
One of two Tabula drawings. To me they recall the wall charts once used in school biology and chemistry lessons, which showed species of animals or electron orbitals side by side, a little like the drawings of Ernst Haeckel.
Plotter pen and hand pencil, including neon pencil, on watercolour paper
60 × 85 cm
Unique edition